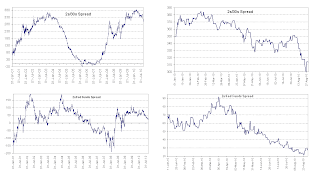
As you all know, bonds have been supported nicely by the recent fear that the US may slip into another recession, and in particular the long end of the curve. This has led to a noticeable flattening, just as it did prior to the financial crisis in 2008 (albeit for different reasons.) Nonetheless, yields at the long end have plummeted and one is getting about 2.54% (at the time of this writing) for lending money to the government for 10-years. The graph below shows how the curve has flattened since the beginning of the year.
As we peek into the spread between the yields on the active 10-year and 2-year issues, it is clear that there has been an alarming tightening. This sharp and consistent decline reared its ugly head back in Q1 of 2004. What followed was a 3-year tightening of the spread and an inverted yield curve (as shown by the negative spread between the two.) But one also must also look at the previous 2 occurrences of extreme tightening over the past 2-years and see that yields did, in fact, bounce back. Now granted, I understand the circumstances were different back then than they are now. What's important to note is that the curve still remains steep and the red flags don’t need to be put up just yet, however I think a yellow caution flag is in order. The charts below show the recent movement of the 2/10-year spread. Here we have spreads creeping lower, as the 2-year note touches all time lows.
The 2/30-year and 2-year/Fed Funds spreads are also experiencing the same type of tightening. What's particularly interesting is that the 2-year/Fed Funds spread is the tightest since December 2008(when the Fed moved its target for the Funds rate to 0.0%-0.25%) and has shown no signs of slowing down here in 2010. If the Fed leaves rates untouched till the end of 2011, we may see this spread tighten to single digits and possibly even touch negative territory. Which would raise a whole new set of questions because well, what happens with bill rates? Do they approach 0.00%? These scenarios may seem unlikely, but its something to keep in the back of ones head. Personally, I don’t think yields will drop too much further.
As opposed to the tightening of the Treasury spreads, we have the Baa/10-year spread widening to levels not seen since August 2009. This is led by the desire to hold Treasuries amid economic uncertainty and the avoidance of corporate debt. Contributing to the widening of this particular spread could be the amount of corporate issuance. Throughout July and August, there has been a stronger amount of corporate supply, compared to 2009, which could have been driving down the price of this particular debt. We are talking issues with Baa rating in this case, and drop in price will increase the yields, which would widen the spread even further. A lot of companies are attempting to finance expansion with these extremely low rates, clearly evident by the recent increased issuance. However, through August 20 corporate issuance is down about 10-12% compared to 2009.
Moving away from fixed income spreads, we will show how inter-bank lending credit spreads can serve as barometers for the economy. Our first spread is the dollar Libor/OIS. I cite the dollar spread because it has tightened significantly over the past month to levels considered more "normal." The same cannot be said for the European spread, which is the difference between the 3-month Euribor and the 3-month Eonia. This spread continues to widen, allowing us to conclude that EU banks are having problems. More evidence that concludes EU banks are in a scramble for liquidity stems from the fact that banks have gone to the ECB each of the past 3 Wednesday's and bid on dollar deposits. But, that is neither here nor there. Lets move on to the US TED spread, the difference between the 3-month Libor and 3-month T-Bill. As you can see, the spread has tightened considerably and now rests at levels not seen April. Using the TED and Libor/OIS spreads as barometers for the health of the US economy, it can be concluded that things may not be as bad as we think they.
So what does all this mean? Well in conclusion I would like to make a few points that should be taken to heart. It appears that these spreads are leading us in 2 different directions. For starters the yield curve spreads appear to show a flattening of the curve (although it is still steep and healthy) and maybe inverted down the line, which could signal a recession on the horizon. However, I do not think this is the case. Spreads may tighten further down the road, with the Fed's easy money and projected slow growth, but I do not think we will have an inverted curve. Flatter curve? Yes. This does not mean a recession will follow suit. Now, while the flattening of the curve may be troublesome, other credit spreads such as the TED and Libor/OIS spreads don’t seem to be telling that story. In fact, both are back to "normal" levels, after skyrocketing during the European Debt Crisis. This has indicated a healthy inter-banking lending market, which is an important factor in growth.
Now, back to my reference about punching a shark in the nose. By this, I mean shorting Treasuries and/or moving into diverse dividend yielding stocks, as evidenced here by my pal Jefferson Starship. Once the economic data turns positive, I would jump into TBT, which shorts the 30-year, long earl, (OIH or SCO), and maybe even a double long S&P (SSO). I realize these are risky but if they can all be timed right in tandem, once can make a handsome return.
-Andrew


